SkyPad is an excel add-on that can analyze multiple particles tracks at once using the coordinates (in 2D or 3D) and retrieves several parameters, such as speed, number of pauses, duration of pauses, persistance, percentage of time in motion…). It gives both the analysis of each particle and a compilation of all of them with the standard deviation.
It needs spatial coordinates (x,y and z) and frame numbers in separate columns obtained by manual or automated tracking. Tracks have to be one after the other without headers between them. Also, they all have to start from frame number one.
Download the last version from here: SkyPad.
If you use it, please cite Cadot et al, Plos One 2014.
Installation on Windows: In Excel, Open File>Options>Add-ins.
In Manage Excel Add-ins, press Go and then browse. Locate the SkyPad.xlam file and press OK.
To run, just press Ctrl+Shift+S. It will open the following Dialog Box:
– In the square “Parameters”, indicate the columns where you have the coordinates and the frame numbers by their letters.
– If you didn’t calibrate your images before retrieving the track coordinates, you can do it here; different length units are available. If your images were calibrated, just write “1” in the Length conversion factor”.
– Different time units are also available.
– Distance threshold: because manual or automatic tracking can make some errors in finding the centroid of your particle, but also because you don’t want to take into account brownian displacements in your analysis, a minimal distance you think can be considered as a real displacement can be inserted here. For example, if your particle has a diameter of 10um, displacements less than 5 um might just be Brownian fluctuations or tracking errors.
– Speed threshold: is something moving at 1um a day is really moving? You can set to 0 if you want, but similar to what we do with Kymographs, speeds lower than a certain threshold are not considered and the the frames where this speed is obtained are considered as pauses.
– Number of particles to track: Self explaining, I guess.
Options:
– If you have 3D trajectories, check the box and indicate the column where the z-coordinates are listed.
– You can visualized the individual 2D tracks at the end with the points thresholded based on your parameters: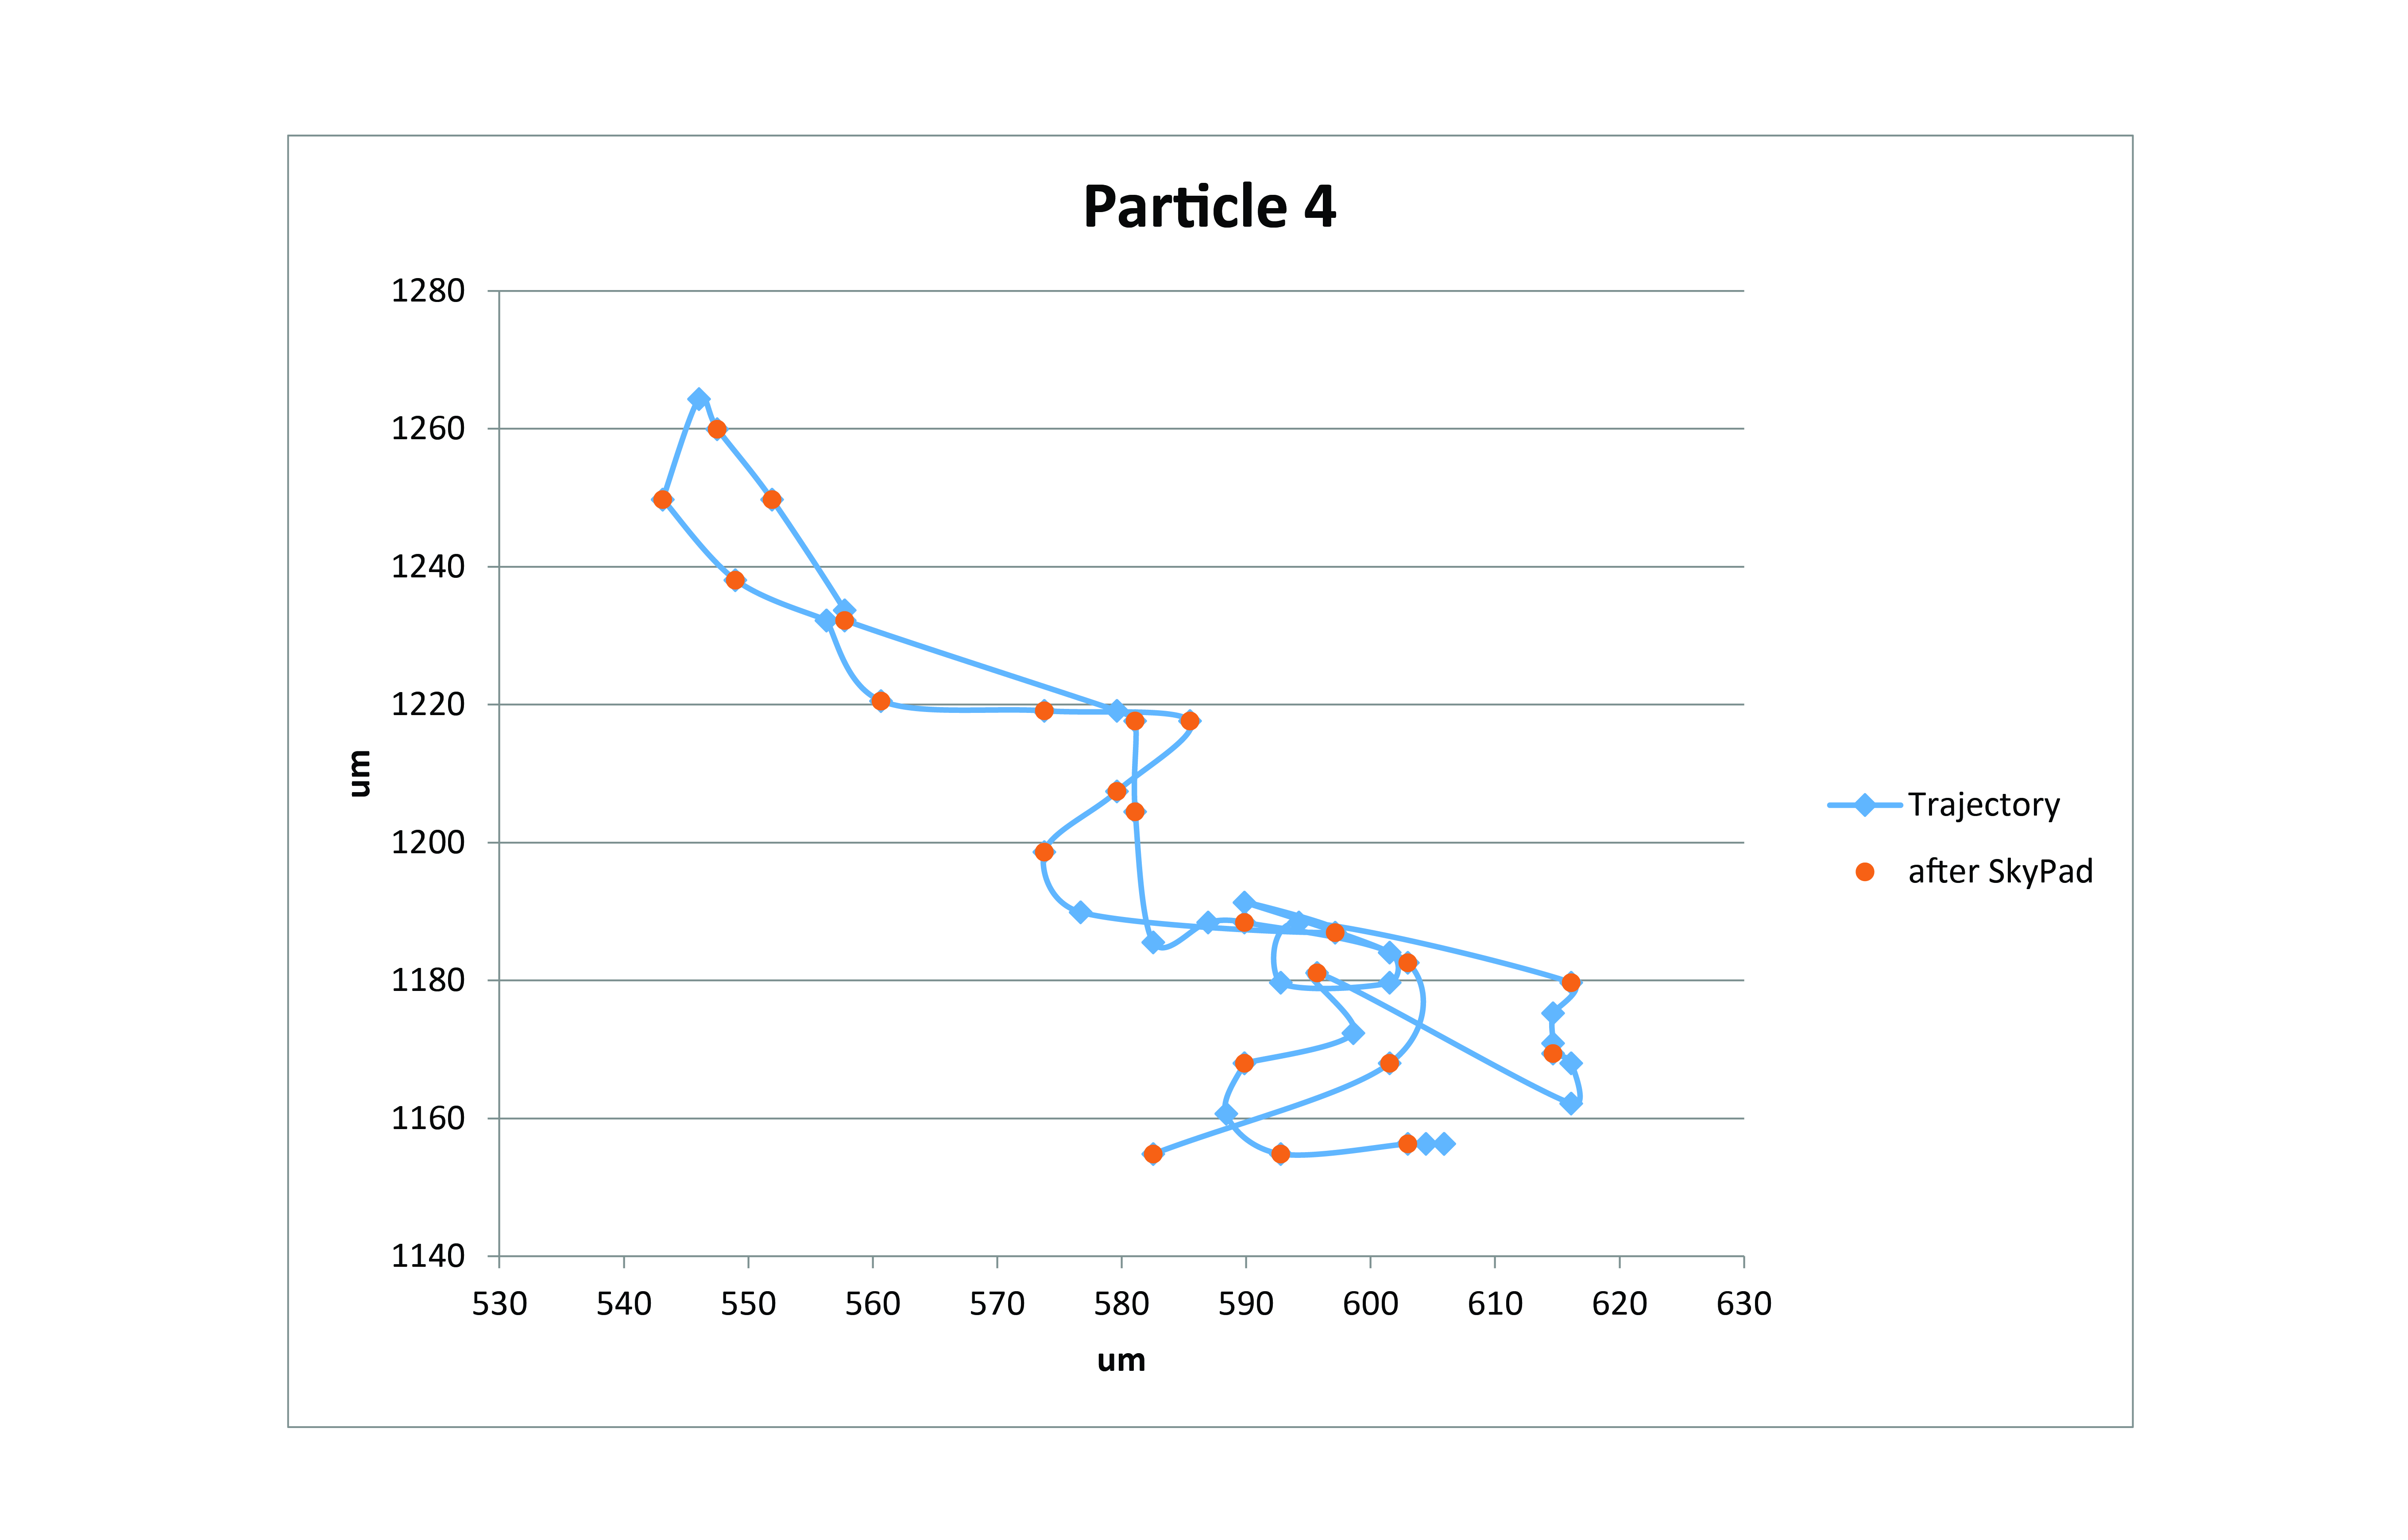
– Persistance can be calculated (shortest distance between start and end over the actual distance covered by the particle).
– You can have an overlay of all the tracks starting from 0, useful to visually compare conditions.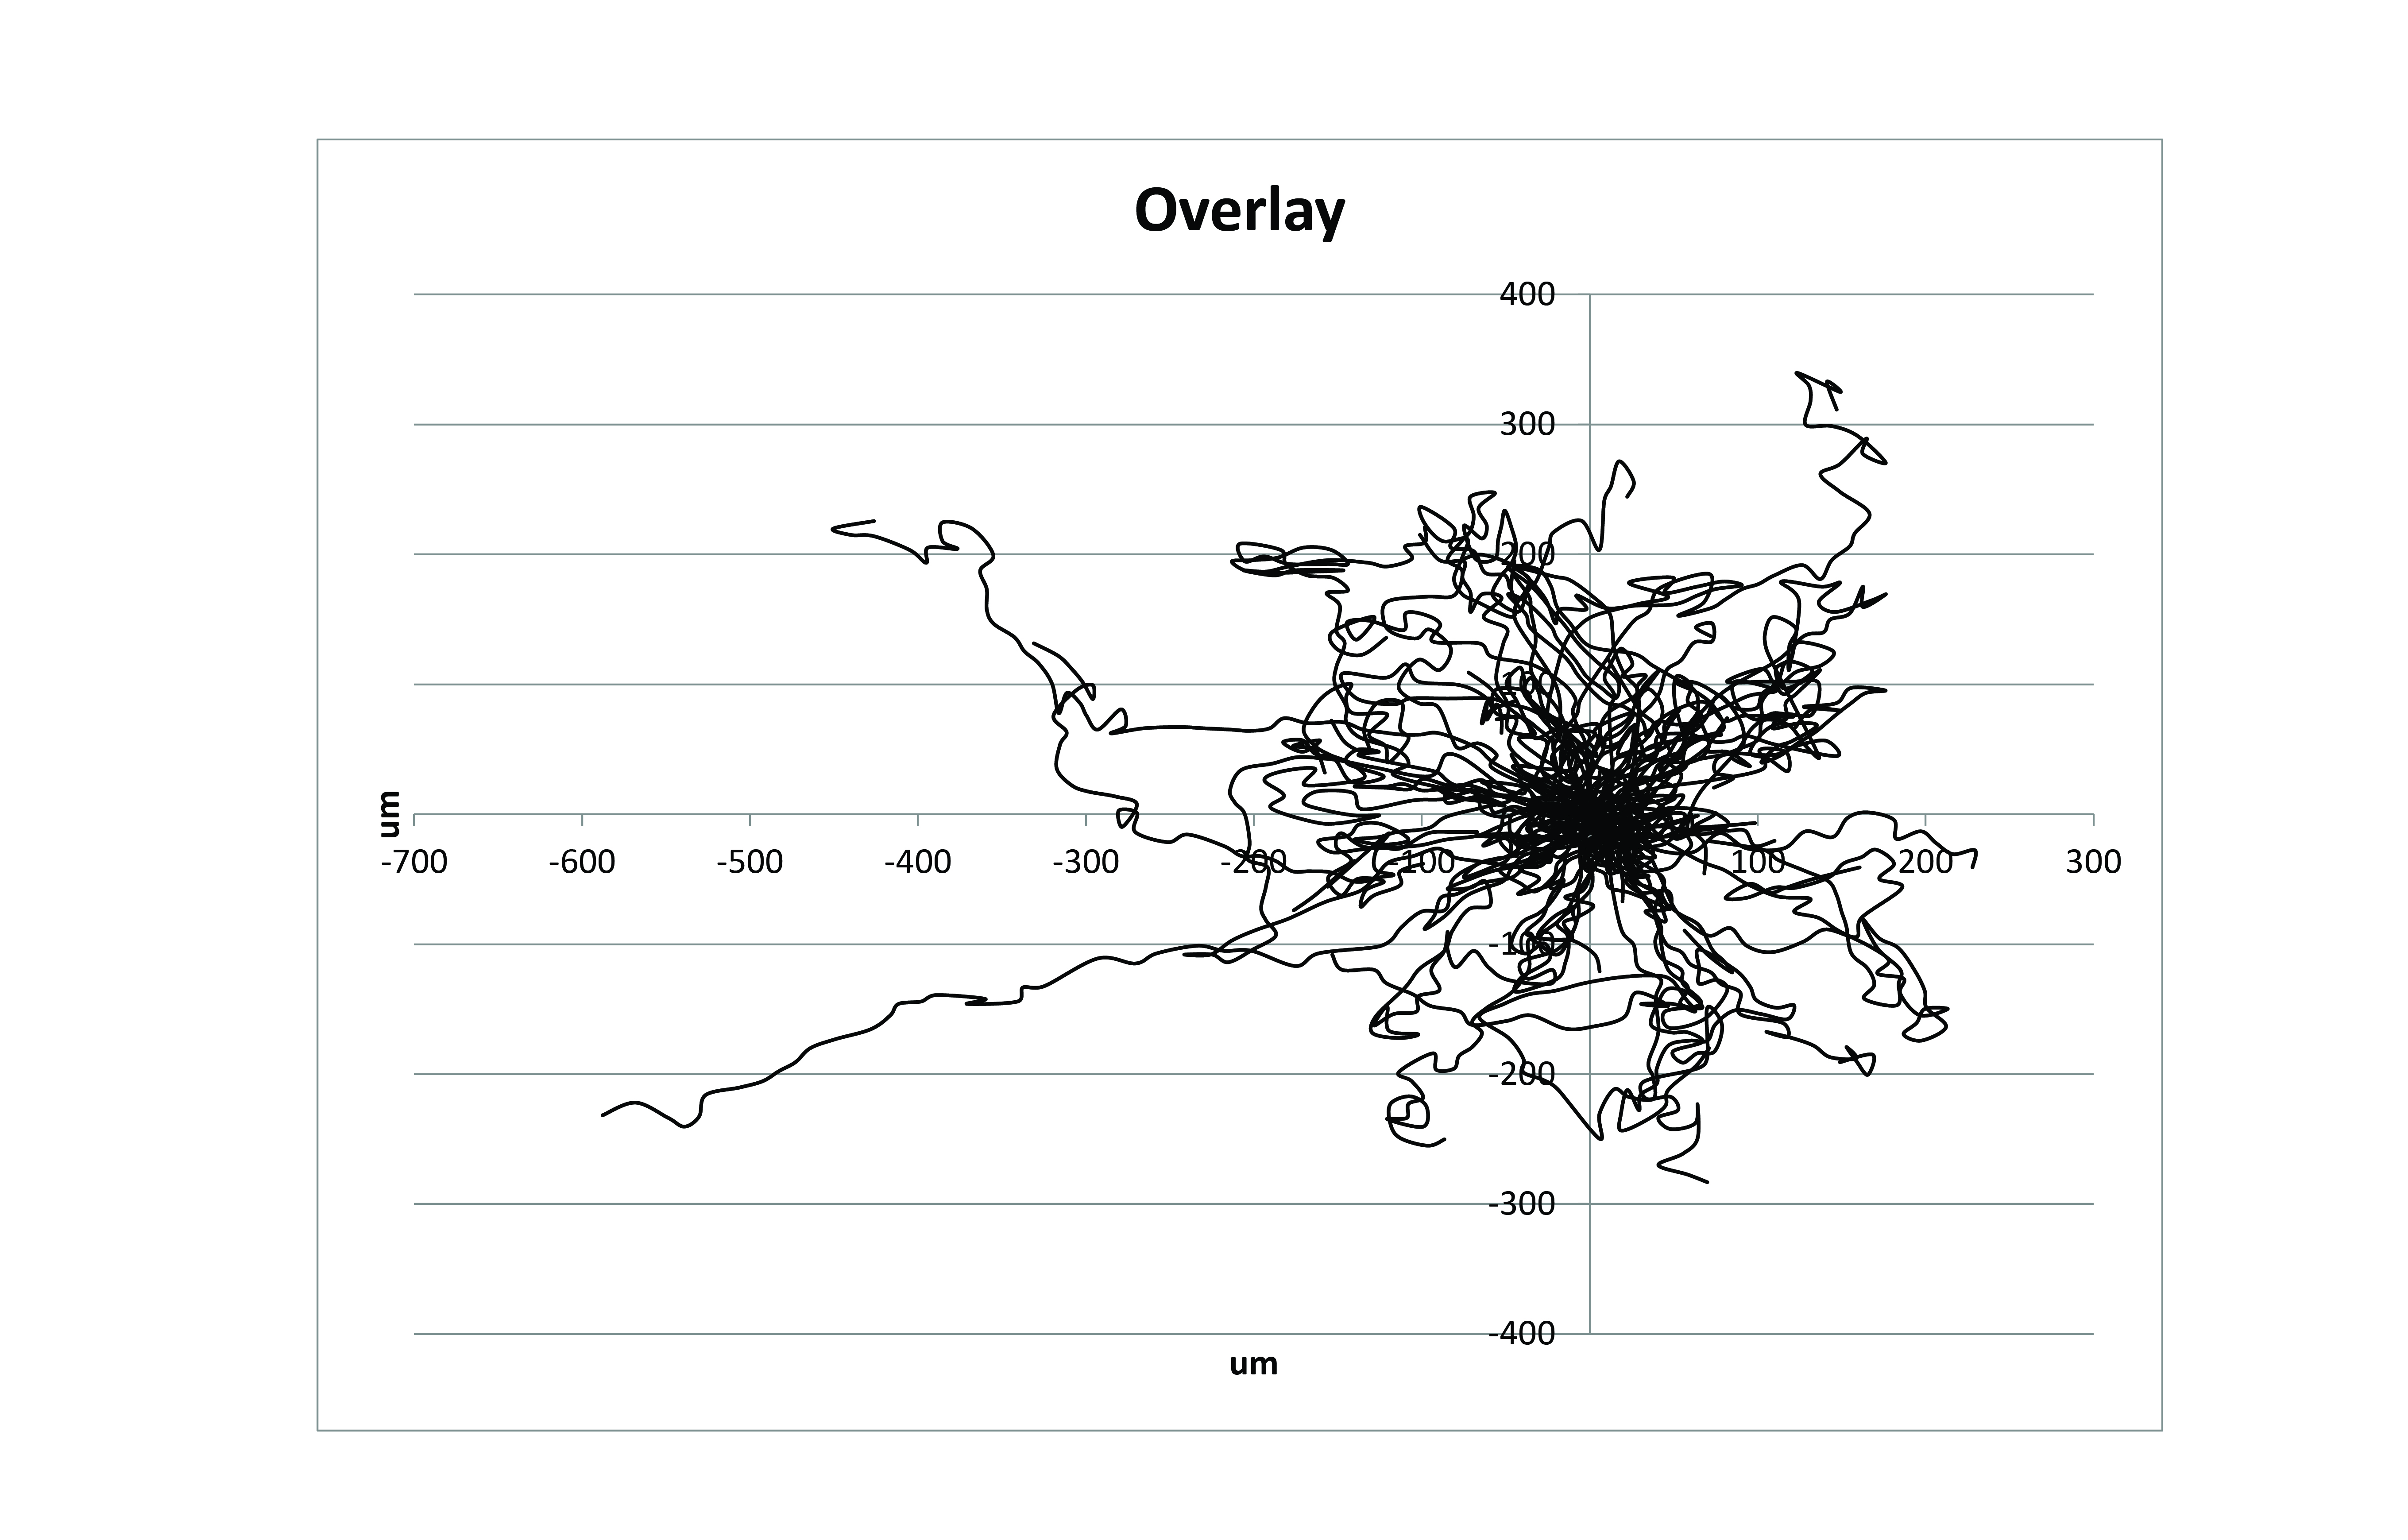
At the end, you will obtain the analysis for each track and a compilation, such as (particles mostly always moving): 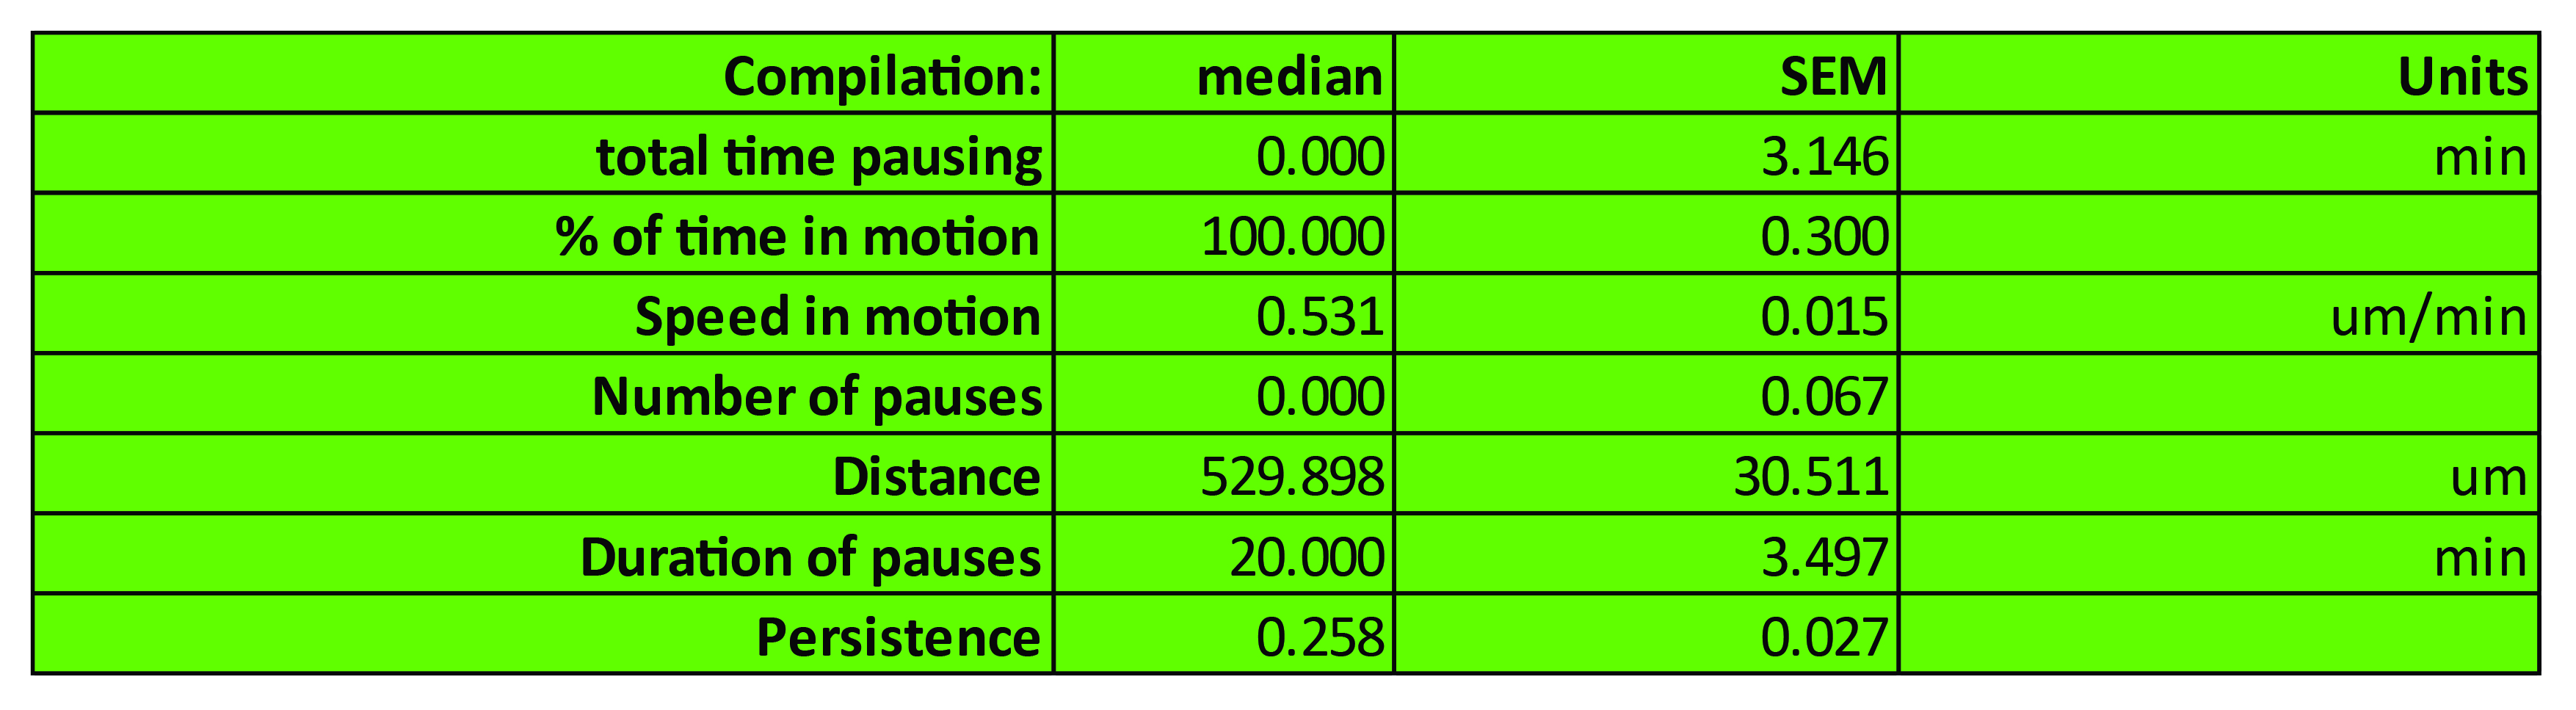
The parameters used will also be indicated in the spreadsheet and will be directly inserted in the dialog box if you re-run the script:
